A smiling woman with glasses holding a smartphone, surrounded by charts and a tablet displaying a presentation and a group photo, illustrating business or marketing analytics.

ASSESSMENT REPORTS

Deliver stand-out feedback reports and results

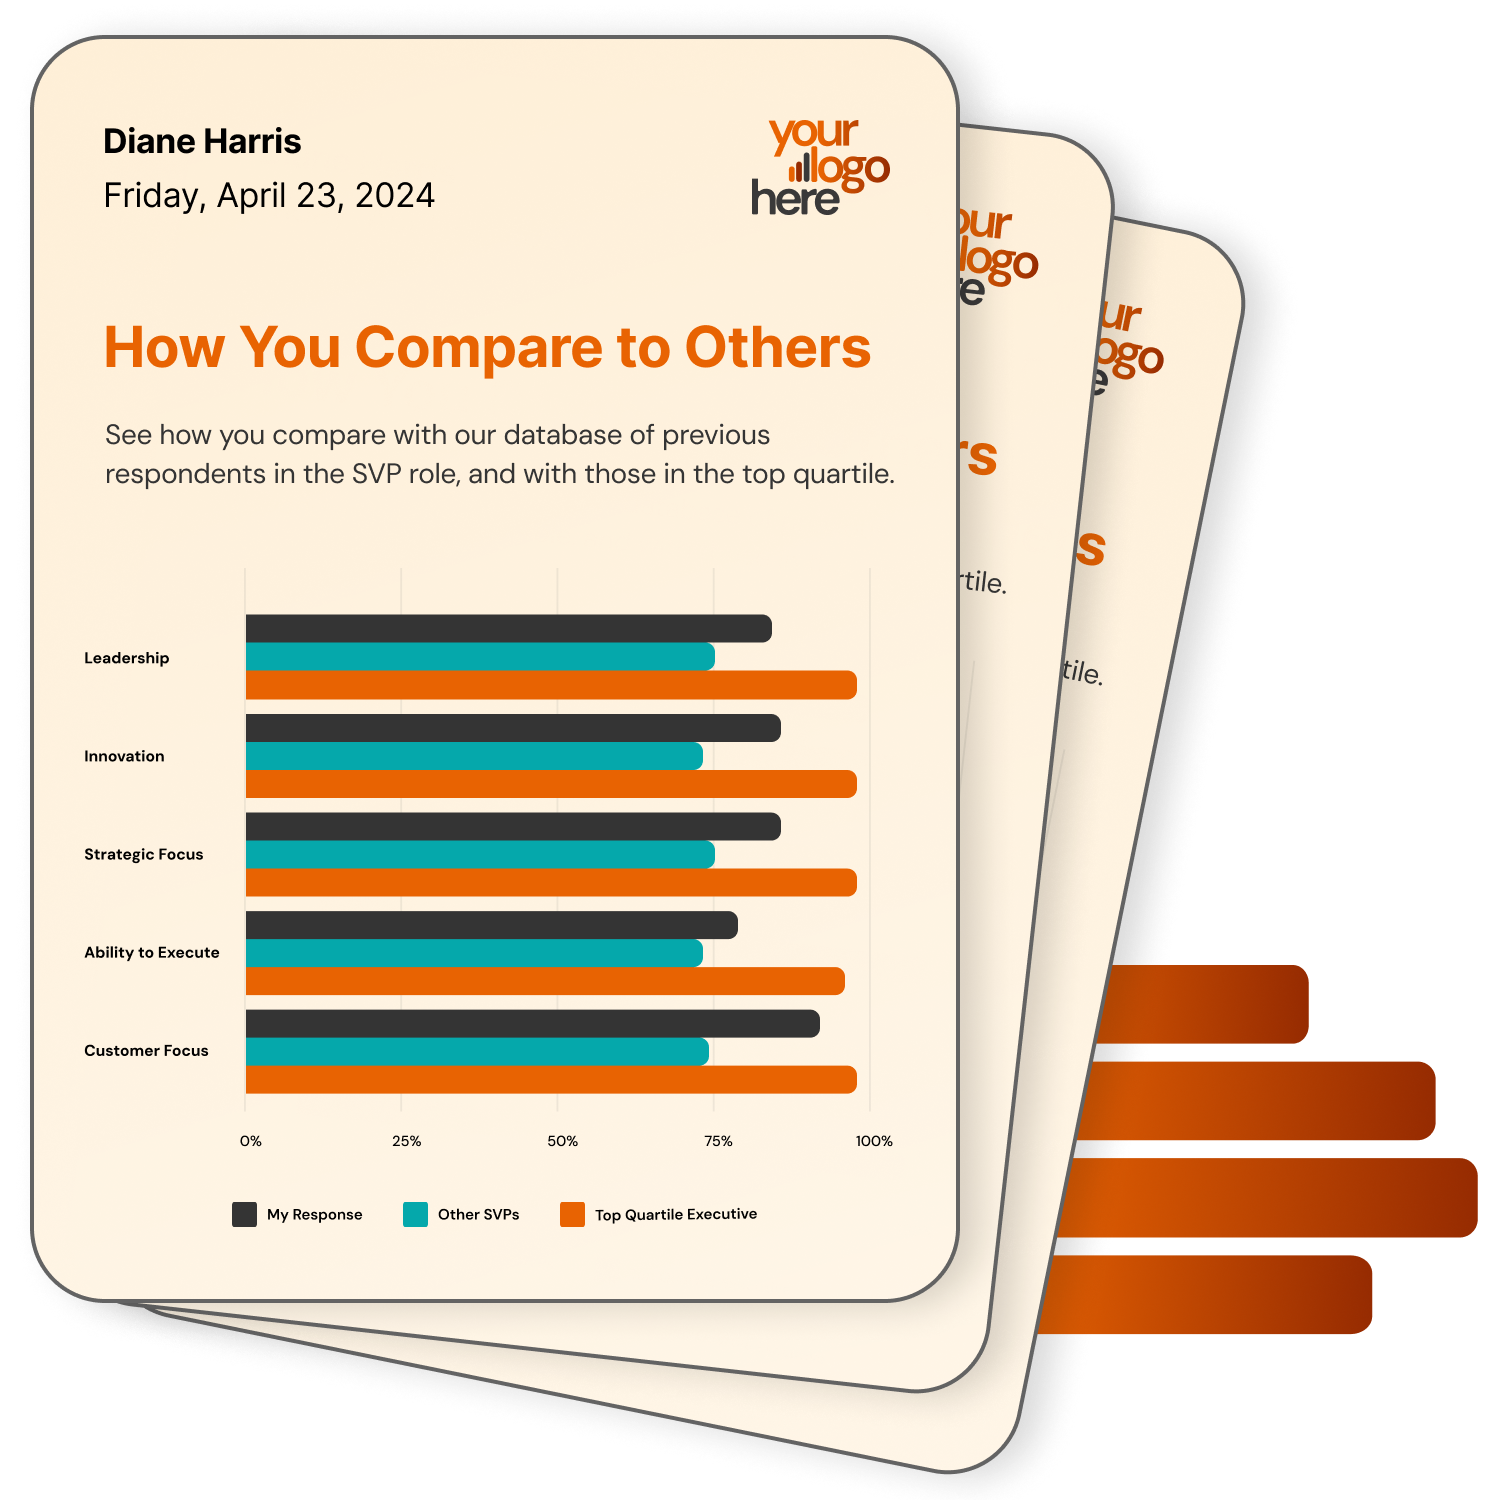
Tell the story of assessment results in a way that engages respondents and assessment managers. Deliver feedback in three different formats: as a live results dashboard, a PDF Report, or an editable Word Document.

Assessment feedback in three different formats

Use separately or in combination to deliver your feedback in the way that works best for your Brilliant Assessments.

Two infographics presenting survey data. The first shows the average question scores for four traits: Encourage Make it Happen Culture at 82%, Accepting Things Will Go Wrong at 54%, Respecting Work Life Boundaries at 57%, and Being Caring and Compassionate at 45%. The second infographic displays answer distribution percentages across five response categories: Never, Occasionally, Sometimes, Usually, and Always for each trait.

Results Page

Live and available at every level of assessment, bring your feedback to life with Results.

Word Report

Accessible and editable, our Word Feedback reports are supported by text readers and allow respondents to easily add comments.

Three printed reports with a bar chart titled "How You Compare to Others." The reports show survey responses from respondents in various leadership categories, including "Leadership," "Innovation," "Strategic Focus," "Ability to Execute," and "Customer Focus." The bars depict responses from "My Response," "Other SVPs," and "Top Quartile Executive."

PDF Report

Beautiful and printable, our PDF reports can be emailed directly to respondents, assessors or managers upon completion.

Build your feedback your way

Charts

Choose from 18 different chart types and formats

From classics like pie, bars, and line through to more jazzy alternatives like scatterplot, polar, circumplex, and spider charts, Brilliant Assessments leaves you spoilt for choice. Even the most detailed charts can be created in a matter of clicks without manual calculations or formulas.

Screenshot of a user interface featuring a gauge manager window with options for merge type, display, and rating type, and a donut chart showing 78%.
Screenshots of a document editing software and a merge manager interface displaying top three scoring strengths and growth potential areas, including leadership style, decision making, and developing people.

Rating & Report Content

Make written feedback personal and relevant

You can easily add text, images, and even videos to your reports that are related to a rating or to a specific answer. This is defined when you build your assessment and called on by selecting the relevant fields from the dropdowns.

Screenshots of a user interface for a BA Merge Manager application, showing options to select merge type, show assessments, section, cohorts, responses, display as percentages, and rating type. One screenshot displays a pie chart titled 'Individual Behaviors' with percentage values for Senior Manager, Board Member, Executive, Manager, Supervisor, and Other.

Drilldowns

Get into the detail with drill-down charts

Set up components of charts so they can be drilled down on, or add calls to action in the result tiles that trigger OnDemand content to appear below. This functionality is only available in the results experience of feedback.

A computer screen with a Microsoft Word icon, a bar chart showing ratings on leadership, innovation, strategic focus, ability to execute, and customer focus, and a pop-up window titled 'BA Merge Manager' with options for merging data, including merge type, sections, display, rating type, and labels.

Word Add-In

Bring your charts into Word with the same merge strings

The Merge Manager you use to create charts and feedback in results is also available as an add-in to Microsoft Word. The same merge strings can be used across formats.

Create feedback for any assessment type

A bar chart showing the percentage of people and tasks. The chart indicates that 64% of people prefer a certain working style, while 66% prefer a specific task. There is a speech bubble at the top left with text asking, "What is your preferred working style?".

Individual assessments

Gain instant access to assessment outcomes in dashboard, PDF or an accessible Word format.

A bar chart showing responses to the question, 'How content are your team in their roles?' with 50% replying Yes, 19% Sometimes, 16% No, 7% Unsure, and 8% didn't answer. The chart uses different colors for each response.

Group and cohort assessments

Generate reports on departments, business units, or any other grouping to gain insight on a broader scale.

Bar chart titled 'Leadership attributes April 2022-October 2023' showing percentage scores for attributes: Leadership, Innovation, Strategic Focus, Ability to Execute, and Customer Focus over four time periods. The highest scores in October 2023 are for Customer Focus (93%), Innovation (87%), and Ability to Execute (87%).

Longitudinal assessments

Measure changes in performance or outcomes over time with feedback based on iterative assessments.

You might also be interested in

A digital interface on a tablet screen displays sections labeled Segment A, Segment B, Sub sections, sections, and an entire assessment, with annotations indicating questions, sub sections, sections, and a whole assessment.

Segmentations

Report on connected questions and answers, wherever they appear in the assessment with segmentations.

A digital interface screen showing a section titled 'Administration Privileges' with tabs for different maturity levels and a message about high vulnerability at maturity level zero.

Ratings

Create ratings at every level of your assessment to control feedback specific to where a score lands.

A woman with curly hair smiling and holding a tablet, with bar and line charts in the background and foreground, showing project management data.

Benchmarks

Create unlimited classifiers and set the standard with benchmarks, delivering the ability to measure change over time.