

Assessment Results Builder
Create a brilliant Results
experience
Brilliant Assessments lets you turn feedback into a clear, interactive results page. Share results instantly, add drill-downs to charts for deeper insights, and embed videos to guide respondents through their scores.
Watch a
walkthrough
See what Results can do for your assessment, cohort and individual feedback experience!

Everything you love in your feedback report, brought to life as a results dashboard
Make the delivery of personalized feedback simple and effective. Whether you're providing live results, downloadable reports, or both, Brilliant Assessments offers the flexibility to create detailed and tailored feedback. Complete with features like iteration-based reporting, cohort analysis, and benchmarking, you can deliver insights that matter through your results page—whether at the individual or team level.

Intuitive drag-and-drop builder
Create your results dashboard effortlessly with a drag-and-drop interface. Organize your data visually by adding containers for related insights and placing tiles for individual dashboard elements. Customize tile sizes from a modest 1/6th of the dashboard space to spanning the full width, tailoring the display to your specific needs.
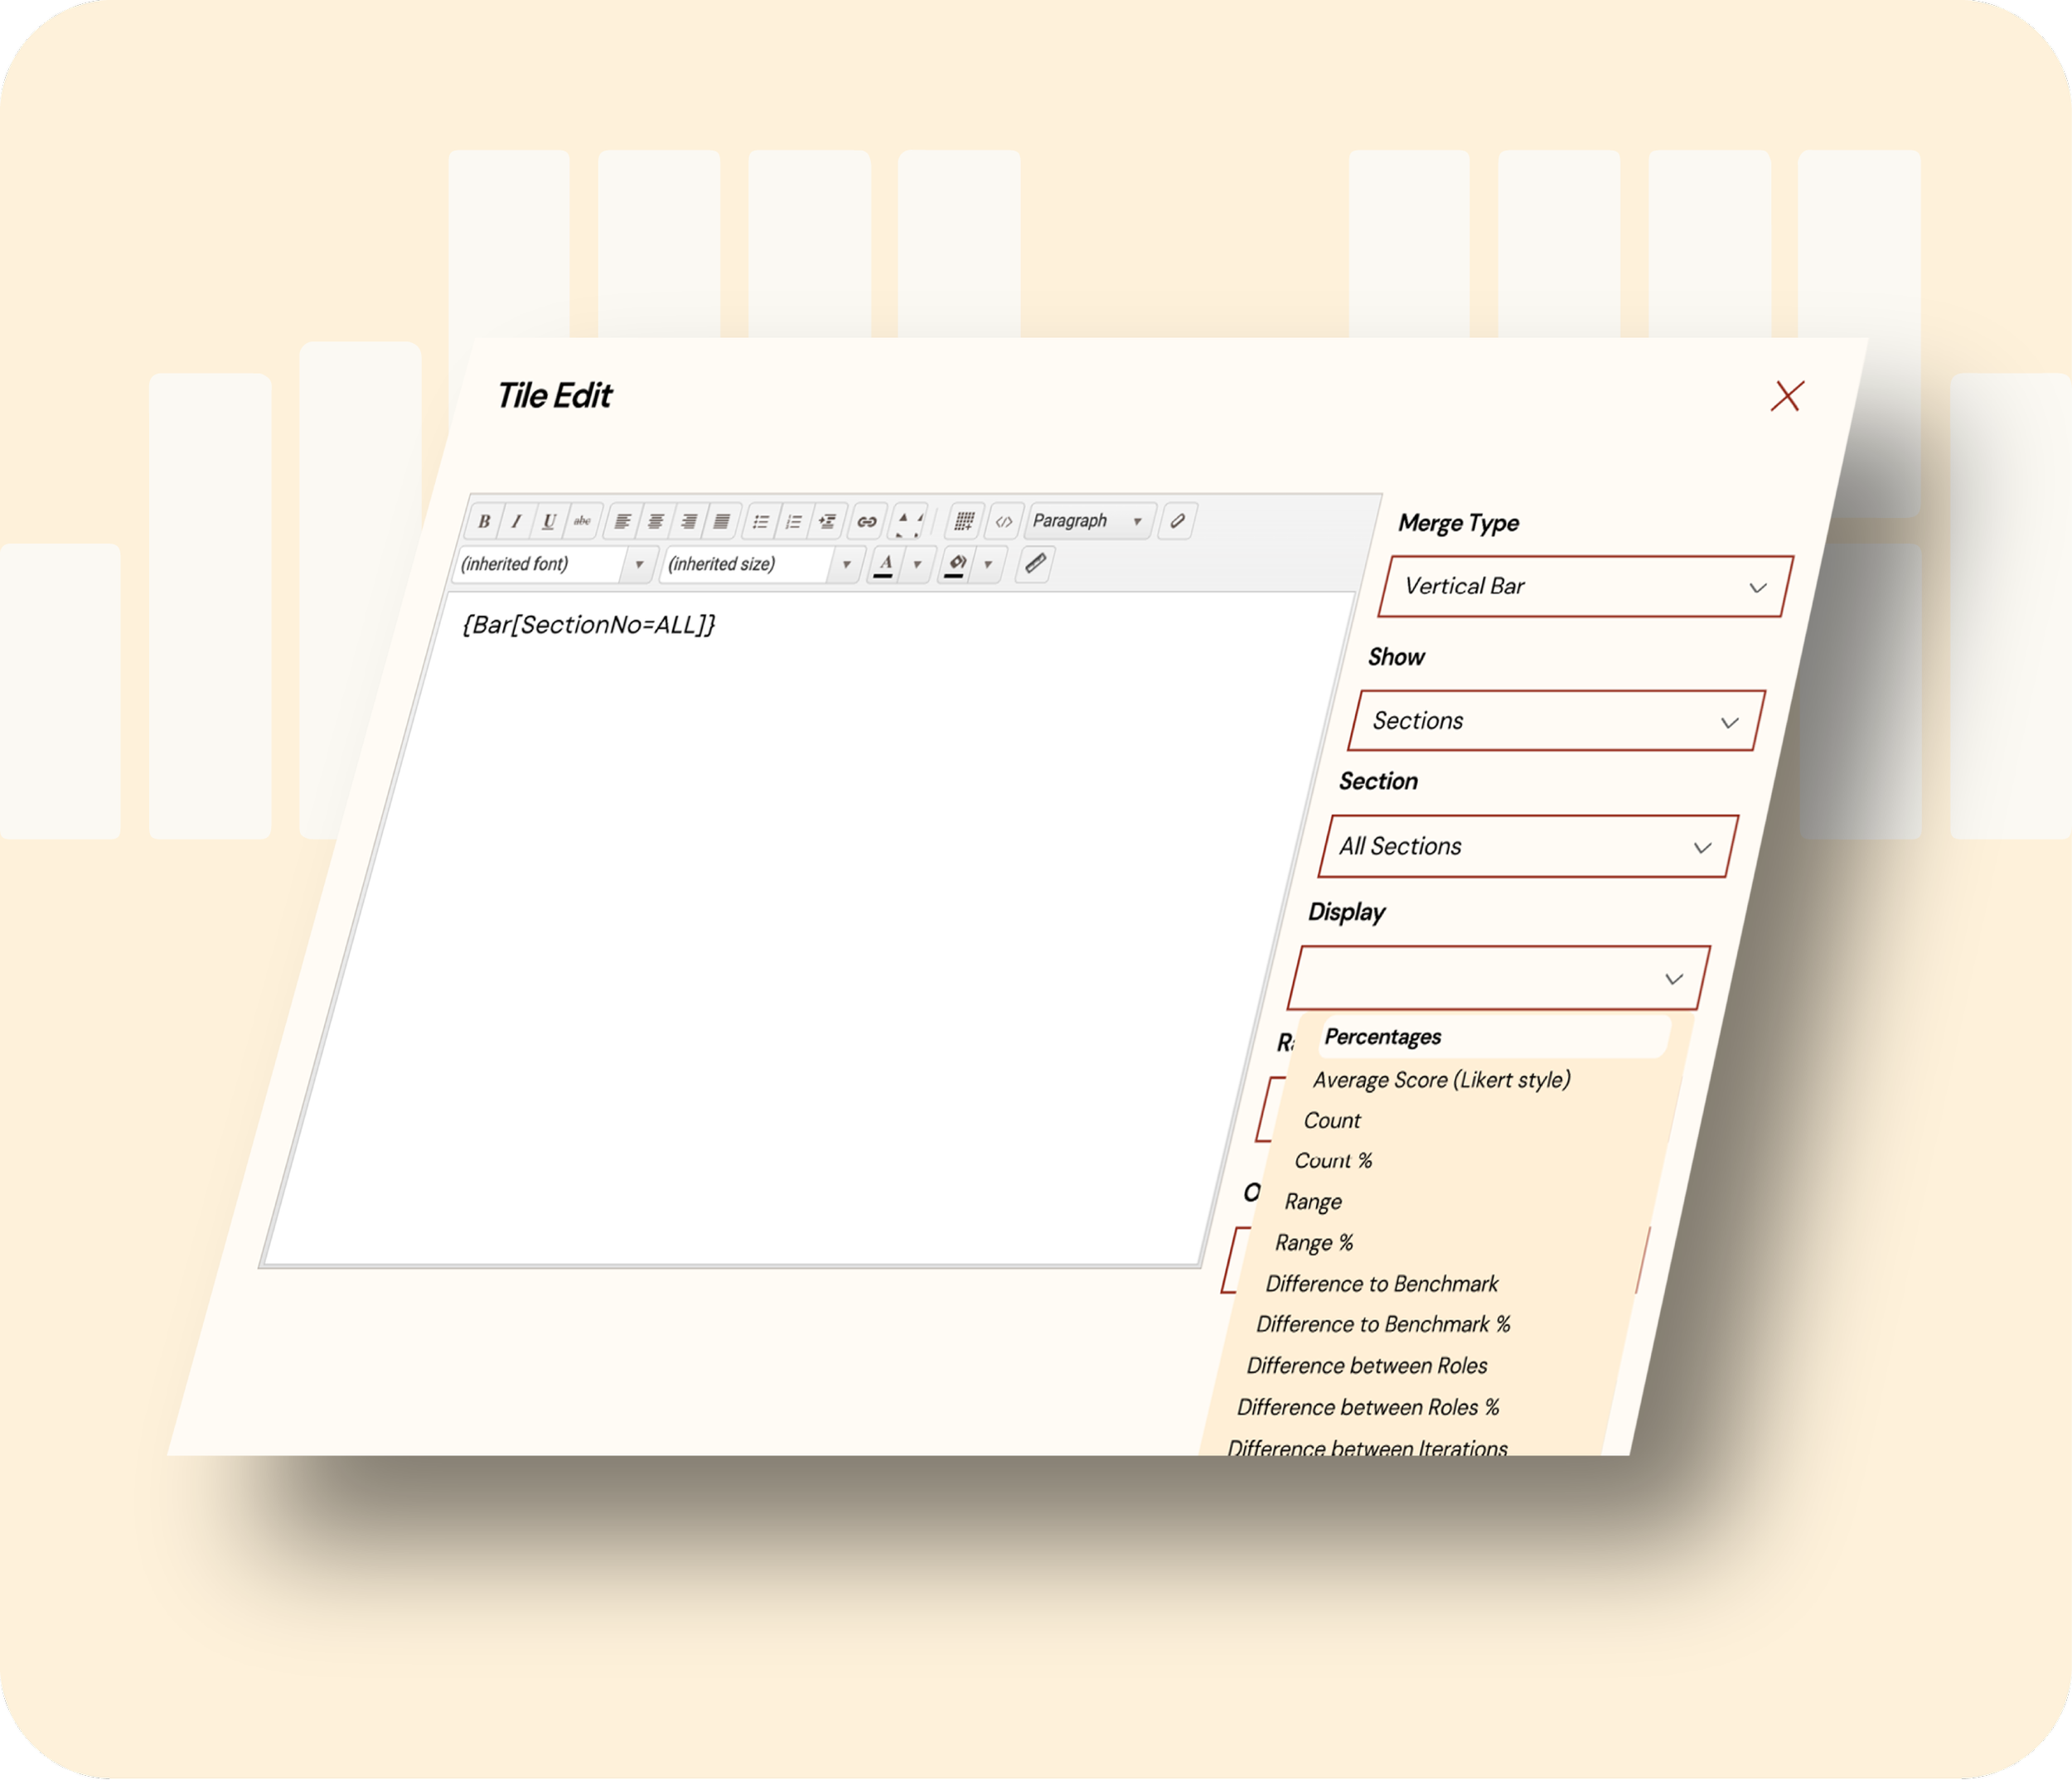
Build deep feedback fast
Build your dashboard elements using our merge string wizard. Start with the chart or rating you want to create and follow the tick box prompts to create your feedback tile. Where other providers require formulas for each chart element, this checkbox approach to building out reports is optimised, accurate, and incredibly user-friendly.

All the charts you know and love
Choose from various different types of charts, including detailed Scatter Plots and Spider charts, to visualize feedback in the most impactful way. These charts dynamically update with new feedback, providing real-time insights for continuous assessments and cohort evaluations.

Rating text integration
Beyond numbers and charts, add ratings to your results dashboards to deliver context and feedback, enhancing feedback beyond quantitative data alone.
Rethink your feedback delivery
Landing page
You can set your personalized Results as the default landing page for Partner Portal users and Administrators when they log in.
Response completion
Upon assessment completion, offer respondents immediate insight with Results dashboards, providing a view of scores and feedback.
Cohorts
Enjoy real-time feedback accumulation, which is ideal for monitoring cohort progress. Then, share these insights easily with clients or teams.